Situation
I have a secret weapon hidden in my back pocket: my deep knowledge of Excel. But if word were to get out that I can build an Excel model in my sleep, who knows what might happen? When I started working at a renewable energy company and saw the challenges they were facing as they experienced significant growth in a short period of time, I knew that I had to blow my cover and pull out every Excel skill in my arsenal.
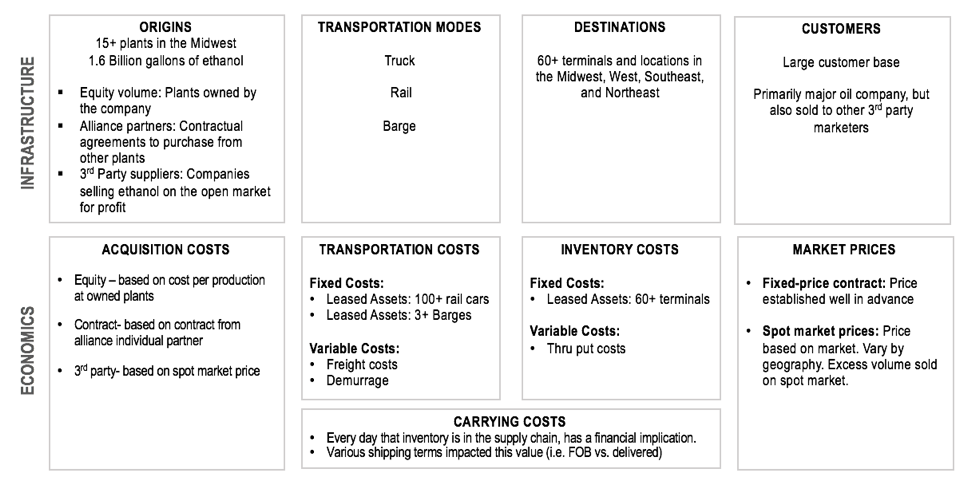
At the time, the company’s biggest challenge was managing supply chain costs. In a highly commoditized environment with razor-thin margins, even small supply chain cost inefficiencies could mean the difference between profit and loss. Decision-making about how and where to distribute millions of dollars’ worth of product was being done manually, with responsibility shared among multiple people. With more than 15 origins and 60 destinations, there were over 900 possible options for sending products to market. The team needed a model that could consider all factors in near real-time to make decisions that would maximize profits.
Actions
I Deconstructed the Supply Chain
- Analyzed the most complex ethanol distribution network in the industry.
- Developed multiple Excel models to simulate key parts of the supply chain:
- Volume Model: Projected volumes from equity plants, alliance partners, and third-party suppliers, considering planned plant shutdowns.
- Cost-to-Serve Model: Estimated production and marketing costs, including transportation, demurrage, inventory costs, and carrying costs.
- Sales Forecast Model: Estimated revenue based on oil price forecasts, location-based demand, and weather impacts.
- Profit Model: Combined the above models to estimate profitability.
I Aggregated Multiple Data Sources
- Collected data about costs and sales for over 900 origin-destination pairs.
- Integrated information from the financial ERP, freight cost management tools, transportation contracts, commodity prices, and production facilities.
I Built a Linear Optimization Model
- Created a macro-enabled Excel model to identify the most profitable supply chain configuration.
- Used a plugin to develop a linear optimization macro that maximized profit by determining the optimal distribution of volume for each OD pair.
I Redefined Supply and Demand Planning Activities
- Fostered collaboration among team members for supply and demand planning.
- Enabled real-time updates and quick decision-making based on market changes.
Results
- Identified $6M in annual supply chain cost savings.
- Reduced quarterly barge lease costs by 40%.
- Regularly used the model to create efficient distribution plans, enhancing decision-making and operational efficiency.
Additional Details
I deconstructed the supply chain – which happened to be the most complex ethanol distribution network in the industry
I developed multiple excel models to simulate key parts of the supply chain.
Considerations included:
Projected volume for each equity plant
Projected volume from alliance partners
Projected volume from 3 party suppliers (number varied from day-to-day)
rd
Planned plant shutdowns
Considerations included:
- Cost to purchase and or produce gallons- Price of product fluctuated often. Model was based on commodities price projections.
- Transportation costs- Rail, barge, or truck. Some locations required multiple modes.
- Demurrage – if inventory has to sit in railcars, because of timing, a fee is charged
- Inventory costs at terminals – We negotiated agreements in advance. At times, we got creative and transloaded (loading from railcars directly to customer trucks)
- Carrying costs – Depending on the destination, it could take up to 1-2 weeks for product to make it to market
- Adjustments – Over time, I incorporated adjustments to costs into model as historical data revealed trends (i.e. seasonality adjustments)
Considerations included:
- Oil price forecast – since our product would be blended with oil, there was a limit to what oil companies would pay based on their own sales projections
- Location – due to supply and demand, sales were higher in some locations than others. For instance, the east coast was saturated and there was a mature distribution network for this type of product. The price was much lower there than in the Southeast, which, at the time didn’t have a network at all. We were the first to be in this market, and as a result were able to charge a premium.
- Weather – weather often slowed down delivery of product, decreased supply, and resulted in an increase in prices.
I aggregated multiple data sources to get information about costs and sales for more than 900 origin destination pairs.
After outlining all of the parts within the supply chain, I gathered data about costs and prices. This was not easy given that this information was distributed throughout the organization.
- Each origin destination pair (OD) was unique for each of these items.
- Every origin had a different amount of volume and cost to purchase or produce.
- Every destination had a different price that product could be sold.
- And each OD pair had a different transportation cost, possibly using up to 3 modes of transportation to get product to market.
- Because of the uniqueness, the model could not just look at cost and sales in aggregate. It had to have these numbers for all 900 combinations.
- Financial ERP
- Tool that manages freight costs
- Contracts from various transportation and inventory agreement
- Commodities prices
- Production facilities
One of the challenges here was keeping the model updated with the latest information. With a static model and inputs from a variety of places, real-time updates were not feasible.
Instead, team members had to import numbers manually. Formulas were put in place to do the heavy lifting with those numbers in place.
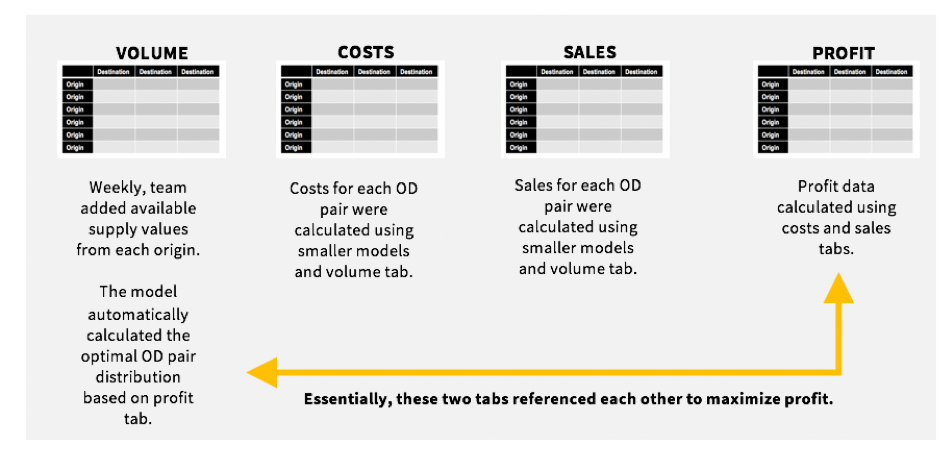
I created a linear optimization model which identified the most profitable supply chain configuration
The goal was to provide an answer about which OD pairs were most profitable and what amounts of volume should be distributed to each location.
Providing this answer required more than a simple excel model. The excel model would only go so far: I could input volumes and then see the profitability calculation. The team could go through and manually check various volumes to see where the optimal distributions were. But that would take time that they did not have.
So instead, I built a linear optimization macro, which on the press of a button would find the distribution of volume for each OD pair that maximized profit. Since what I was trying to do was not accomplished easily using excels core functionality, I used a plugin.
I worked with team members to redefine supply and demand planning activities.
Rather than different people making independent plans using their own tools and methodologies, this became a collaborative activity.
As changes happened in the marketplace, team members could update the model and make quick decisions about supply chain distribution.