Building a Business Intelligence Architecture at Aventine

organization
Capabilities
Timing

2007

Situation


Aventine operated in a volatile, narrow-margin business environment. In order to make data-informed decisions on the fly, employees needed to be armed with the most up-to-date information. Unfortunately, limited visibility to financial data severely diminished decision-making and strategic planning capabilities.

The finance department prepared static reports, but they had several drawbacks:

  • They were only delivered once per month, which is not frequent enough.
  • They were backward-looking, always a month behind.
  • They were limited, excluding critical financial metrics.
  • They were summarized, showing numbers in aggregate with no ability to drill down into data.

Not only are these reports inadequate, but they are also manual and time-consuming to produce. Moreover, because the reports do not meet the needs of employees, the finance department often has to spend additional time completing ad-hoc reports and analysis for specific requests.

Actions


I led effort to implement business intelligence software tools. Once tools were implemented, I developed a series of scorecards, dashboards, and reports to allow teams to monitor operational and financial performance. Specific activities are summarized detailed below.

Worked with business teams that needed access to data to understand requirements

Step 1: Conducted one-on-one stakeholder interviews with all parties:

  • C-Level Officers
  • Senior executive team members
  • Management team members (multiple departments)
  • Front-line employees (multiple departments)

Step 2: Organized all information, preparing various self-referencing documents that articulated business goals and requirements.

  • Documents included
    • Goals & Objectives – Enterprise & Departmental strategic objectives, Supporting KPIs and metrics
    • Personas – Persona details, goals, List of tasks (What decisions does persona make with data?)
    • Task Analysis – Data needed for each task. Steps involved in each tasks
    • Dimensions & Measures – List of dimensions and measures required. Related personas./ Data permission level (to restrict visibility of sensitive data)

Step 3: Created wireframes which illustrated possible dashboard layouts

This was an iterative process which required continuous feedback from stakeholders

Worked with finance department to understand data architecture of financial system and their process.

Step 1: Conducted stakeholder interviews with select members of finance team to discuss:

  • Process used to create monthly reports
  • Data points included on reports
  • Financial assumptions
  • Manual calculations
  • Process used to conduct ad-hoc analysis
  • Most common ad-hoc requests
  • Pain points and challenges to compiling report and conducting ad-hoc analysis

Step 2: Updated previously created requirement documents with new information

Partnered with IT to identify and evaluate business intelligence tools that could integrate with the company’s financial system (Oracle ERP)

 Step 1: I developed scoring criteria based on business and technical requirements


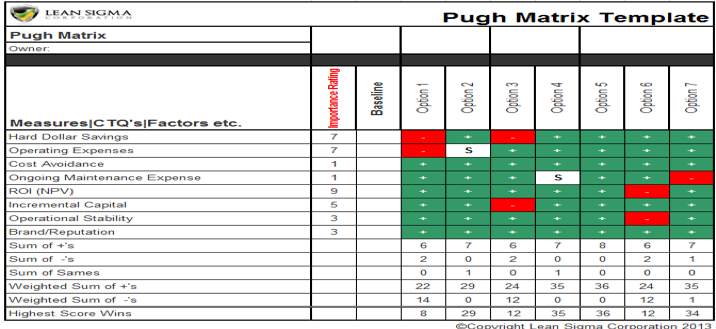
Step 2: I evaluated multiple business intelligence tools using a pugh matrix

  • Pugh Matrix Template examplehttp://www.marketwith.me/mstiffanybritt/wp-content/uploads/sites/5/2019/01/dahboards1.png

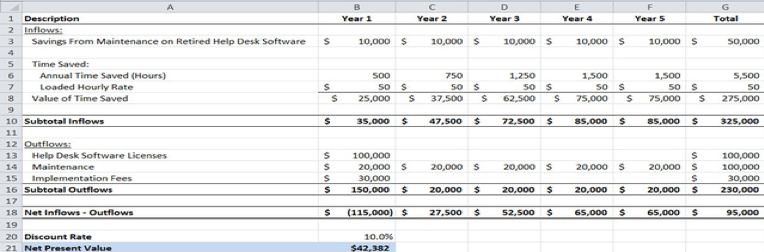
Step 3: I conducted a NPV analysis on the top 3 options

  • NPV Analysis examplehttp://www.marketwith.me/mstiffanybritt/wp-content/uploads/sites/5/2019/01/dashbords2.png

Step 4: I provided analysis and recommendations to C-level executives.

Ultimately, the three technologies that I recommended were selected.

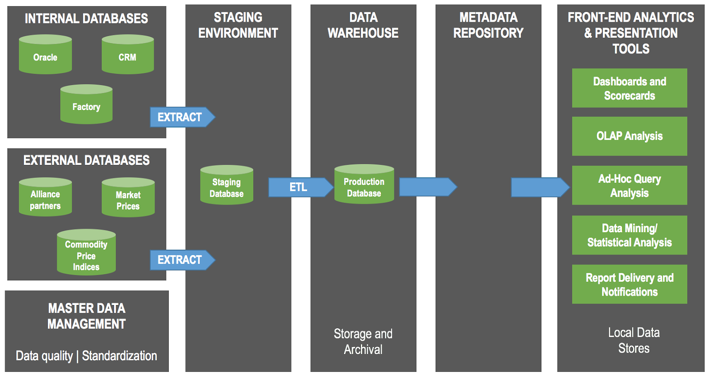
  • Technology selectionshttp://www.marketwith.me/mstiffanybritt/wp-content/uploads/sites/5/2019/01/dashboard3.png

    http://www.marketwith.me/mstiffanybritt/wp-content/uploads/sites/5/2019/01/dashboard4.png

    http://www.marketwith.me/mstiffanybritt/wp-content/uploads/sites/5/2019/01/dashboard5.png

Led effort to integrate financial system with business intelligence software.

Step 1: Worked with members of IT team to construct “as-is” data schema.

This schema visualized data architecture of the company’s Oracle ERP system (Oracle SQL Modeler)

Step 2: Conducted gap analysis; compared data schema to requirements to identify:

  • Missing data points
  • Missing dimensions
  • Data that needed more granularity

Step 3: Worked with members of IT to construct and document the “to-be” data model.

  • Visualization of to-be data architecture

http://www.marketwith.me/mstiffanybritt/wp-content/uploads/sites/5/2019/01/dashboard6.png

Developed 20+ scorecards and dashboards for each business audience which allowed teams to monitor operational & financial performance.

Audience:

  • C-Level officers
  • Senior executive team members
  • Management team members (multiple departments)
  • Front-line employees (multiple departments)

Each dashboard included:

  • Filters to change dimensions (date, categories, etc.)
  • Drill-down data for deeper analysis

To minimize cognitive load and increase understandability, every dashboard had 4 common sections.

    1. Data points related to enterprise objectives
    2. Data points related to departmental objectives
    3. Custom data points and/or views specific to each audiences needs
    4. Industry benchmarks and data points

Results


  • Increased visibility to real-time, actionable data
  • Better, faster decision making
  • Improved strategic planning and financial reporting activities
  • Reduction in time spent by finance teams; increase in accuracy and usefulness of data

organization

Capabilities

Timing

2007

SITUATION

ACTION

RESULTS

Find this information interesting?​

There is more where that came from!

Scroll to Top